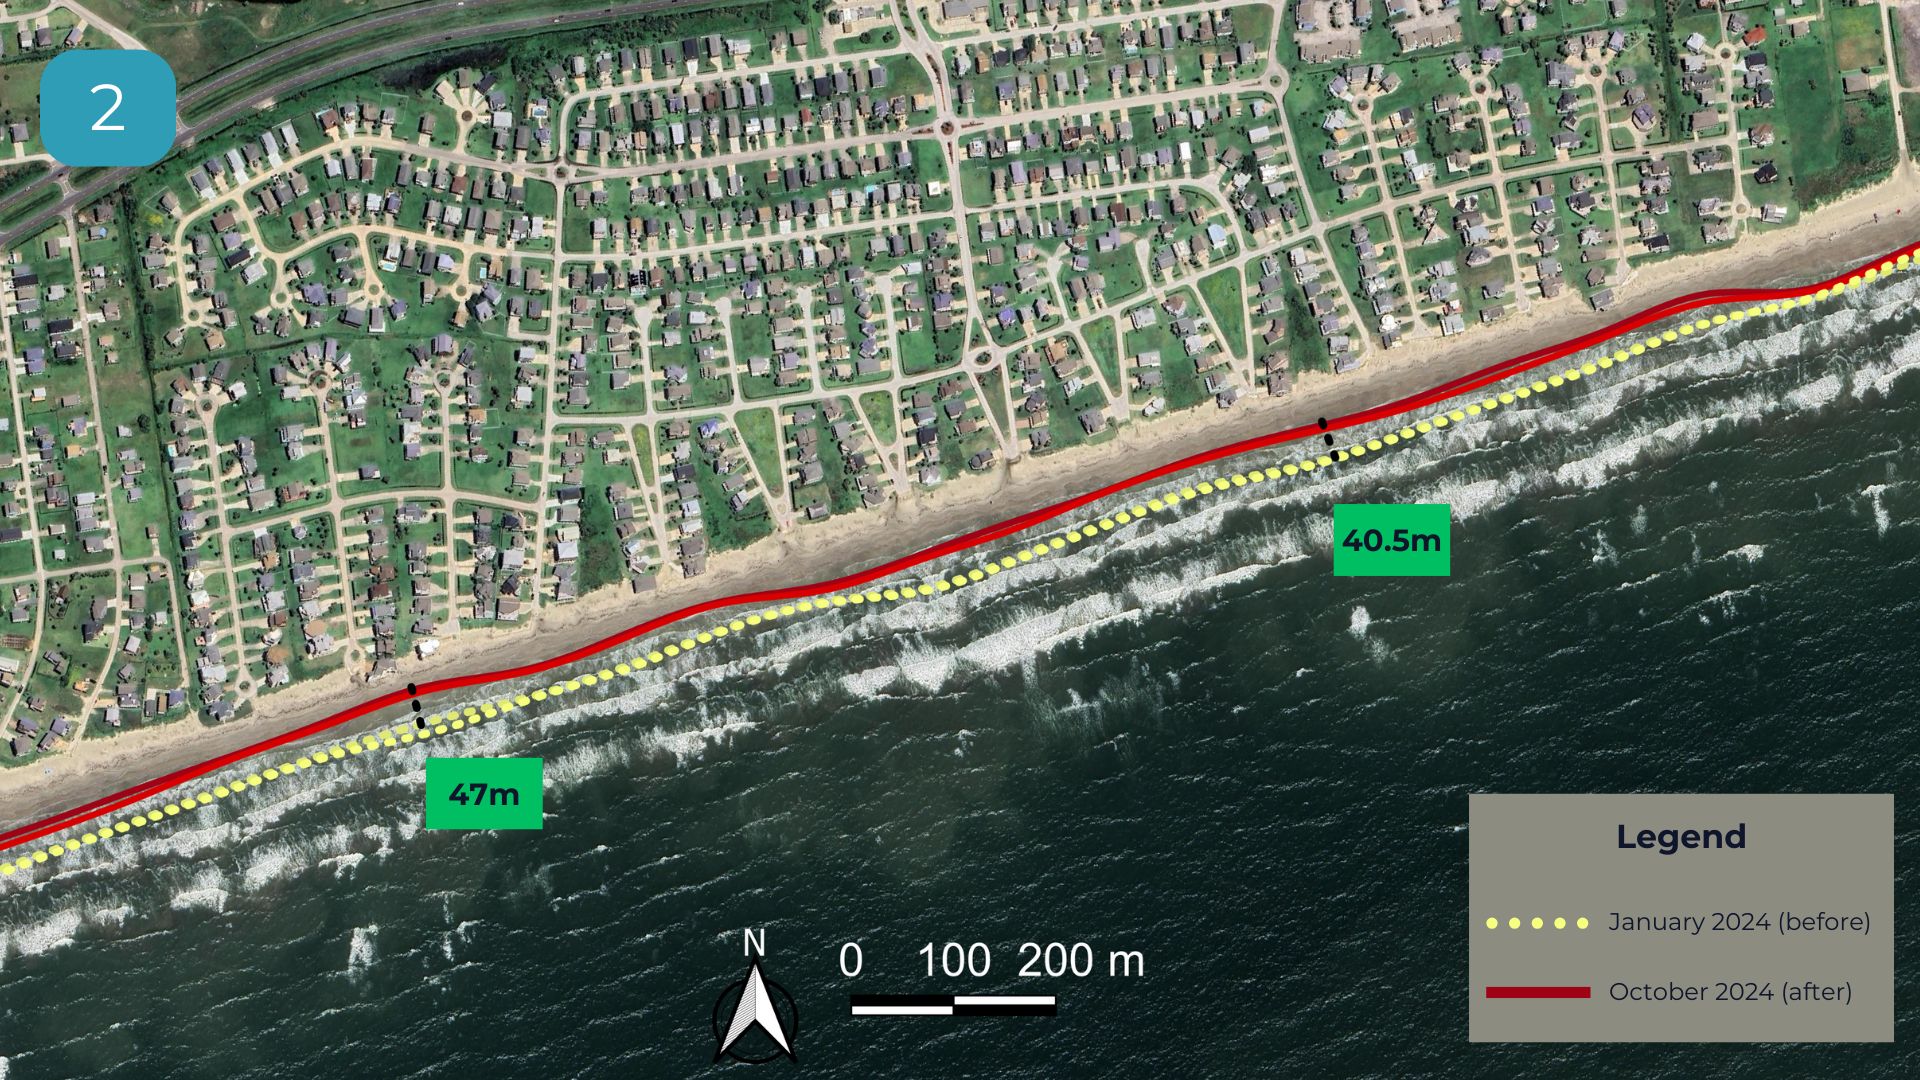
Newsletter

Stay up to date with everything that's happening in the world of Ocean Ledger.

Ocean Ledger provides geospatial insight for coastal physical risk monitoring & intervention

Book a demo

Empowering organisations with historical, locally-specific insight to proactively manage risk.

Click to toggle
1. Precipitation
2. Natural Defences
3. Vertical Erosion
4. Seabed Movement
5. Sea Level Rise (SLR)
6. Horizontal Erosion
1
2
3
4
5
6
Trustworthy &
Transparent Methods
8 Years of R&D at German Aerospace Center (DLR)
Spatial Model Uncertainties
Site-Level Data Calibration
Outcome

Driven
Screening & Deep Dive Use Cases
'What if' Scenario Analysis
Continous asset monitoring
Easy to
Integrate
Report & data-layer download
API access
Flexible payment options
30M
Hectares of coastline analysed
94%
Average accuracy
UN SEEA
compliant
30
Countries mapped
30M
Hectares of coastline analysed
94%
Average accuracy
UN SEEA
compliant
30
Countries mapped
30M
Hectares of coastline analysed
94%
Average accuracy
UN SEEA
compliant
30
Countries mapped
30M
Hectares of coastline analysed
94%
Average accuracy
UN SEEA
compliant
30
Countries mapped
Who we help

We support organisations who model, price and carry storm surge and sea level risk at the site and financial service level.

How it works

Satellite-derived layers capture shoreline change across space & time - above & below the water line.

001
Movement Tracking, Scenario Analysis & Anomaly Detection
Hotspot analysis for ecosystem and shoreline gain & loss
002
Shoreline Movement
Vertical and horizontal shoreline rates of change
003
Underwater Topography
Vertical and horizontal shoreline rates of change
004
Ecosystem Accounting
Underwater & above-water habitat extent, condition indicators & ecosystem services
005
Climate data
Precipitation, wave action, weather patterns
006
Project or Asset location(s)
Digital shoreline & underwater terrain
Case Study

Competitive Underwriting and Risk Advisory in the Coastal Zone

Ocean Ledger validated that its satellite-derived products deliver more accurate loss predictions than Industry Benchmarks, provide real-time intelligence, uncover insights tailored to carrier-specific materiality thresholds, and differentiate risk advisory and broking for coastal assets. We wrote two case studies about it.

Learn more
No items found.
No items found.
No items found.
News

Stay up to date with everything that's happening in the world of Ocean Ledger

View all
Our expertise

We combine expertise across data science, coastal remote sensing, and financial services to deliver state-of-the-art models and insights that lower the barrier for robust coastal mitigation & adaptation efforts.

Paige Roepers

Chief Executive Officer

Dimos Traganos

Chief Scientific Officer

Jeremiah Nieves

Head of Data & Analytics

George Malczyk

Geospatial Engineer
FAQs

Frequently Asked Questions

View all

Accuracy

  • Open-source tools and datasets are incredibly valuable resources and can be a good starting point, depending on budget and project scale. However, they often contain data and time gaps, and their accuracy breaks down when applied at local scales.
  • Ocean Ledger fills these gaps with spatially accurate, frequently updated data — particularly useful for projects tied to financial instruments (e.g. biodiversity credits), which demand up-to-date and verifiable baselines.

Usability

  • Open-source data can typically be downloaded, but it often lacks flexibility for deeper manipulation.
  • Ocean Ledger delivers precise, forecastable data tailored to user needs — and enables integration of field data for comprehensive, context-specific analysis.

Monitoring

  • National open datasets are usually updated every 5–10 years, with limited projections and low transparency.
  • Ocean Ledger updates every 6 days, provides high-resolution forecasts (every 50–100m), and includes uncertainty maps to support rapid decision-making for changing coastal conditions.

Transparency

  • Open data may reference accuracy metrics but rarely discloses full model uncertainties.
  • Ocean Ledger provides spatial and temporal uncertainty metrics, F1 scores, and performance data for every model and output.

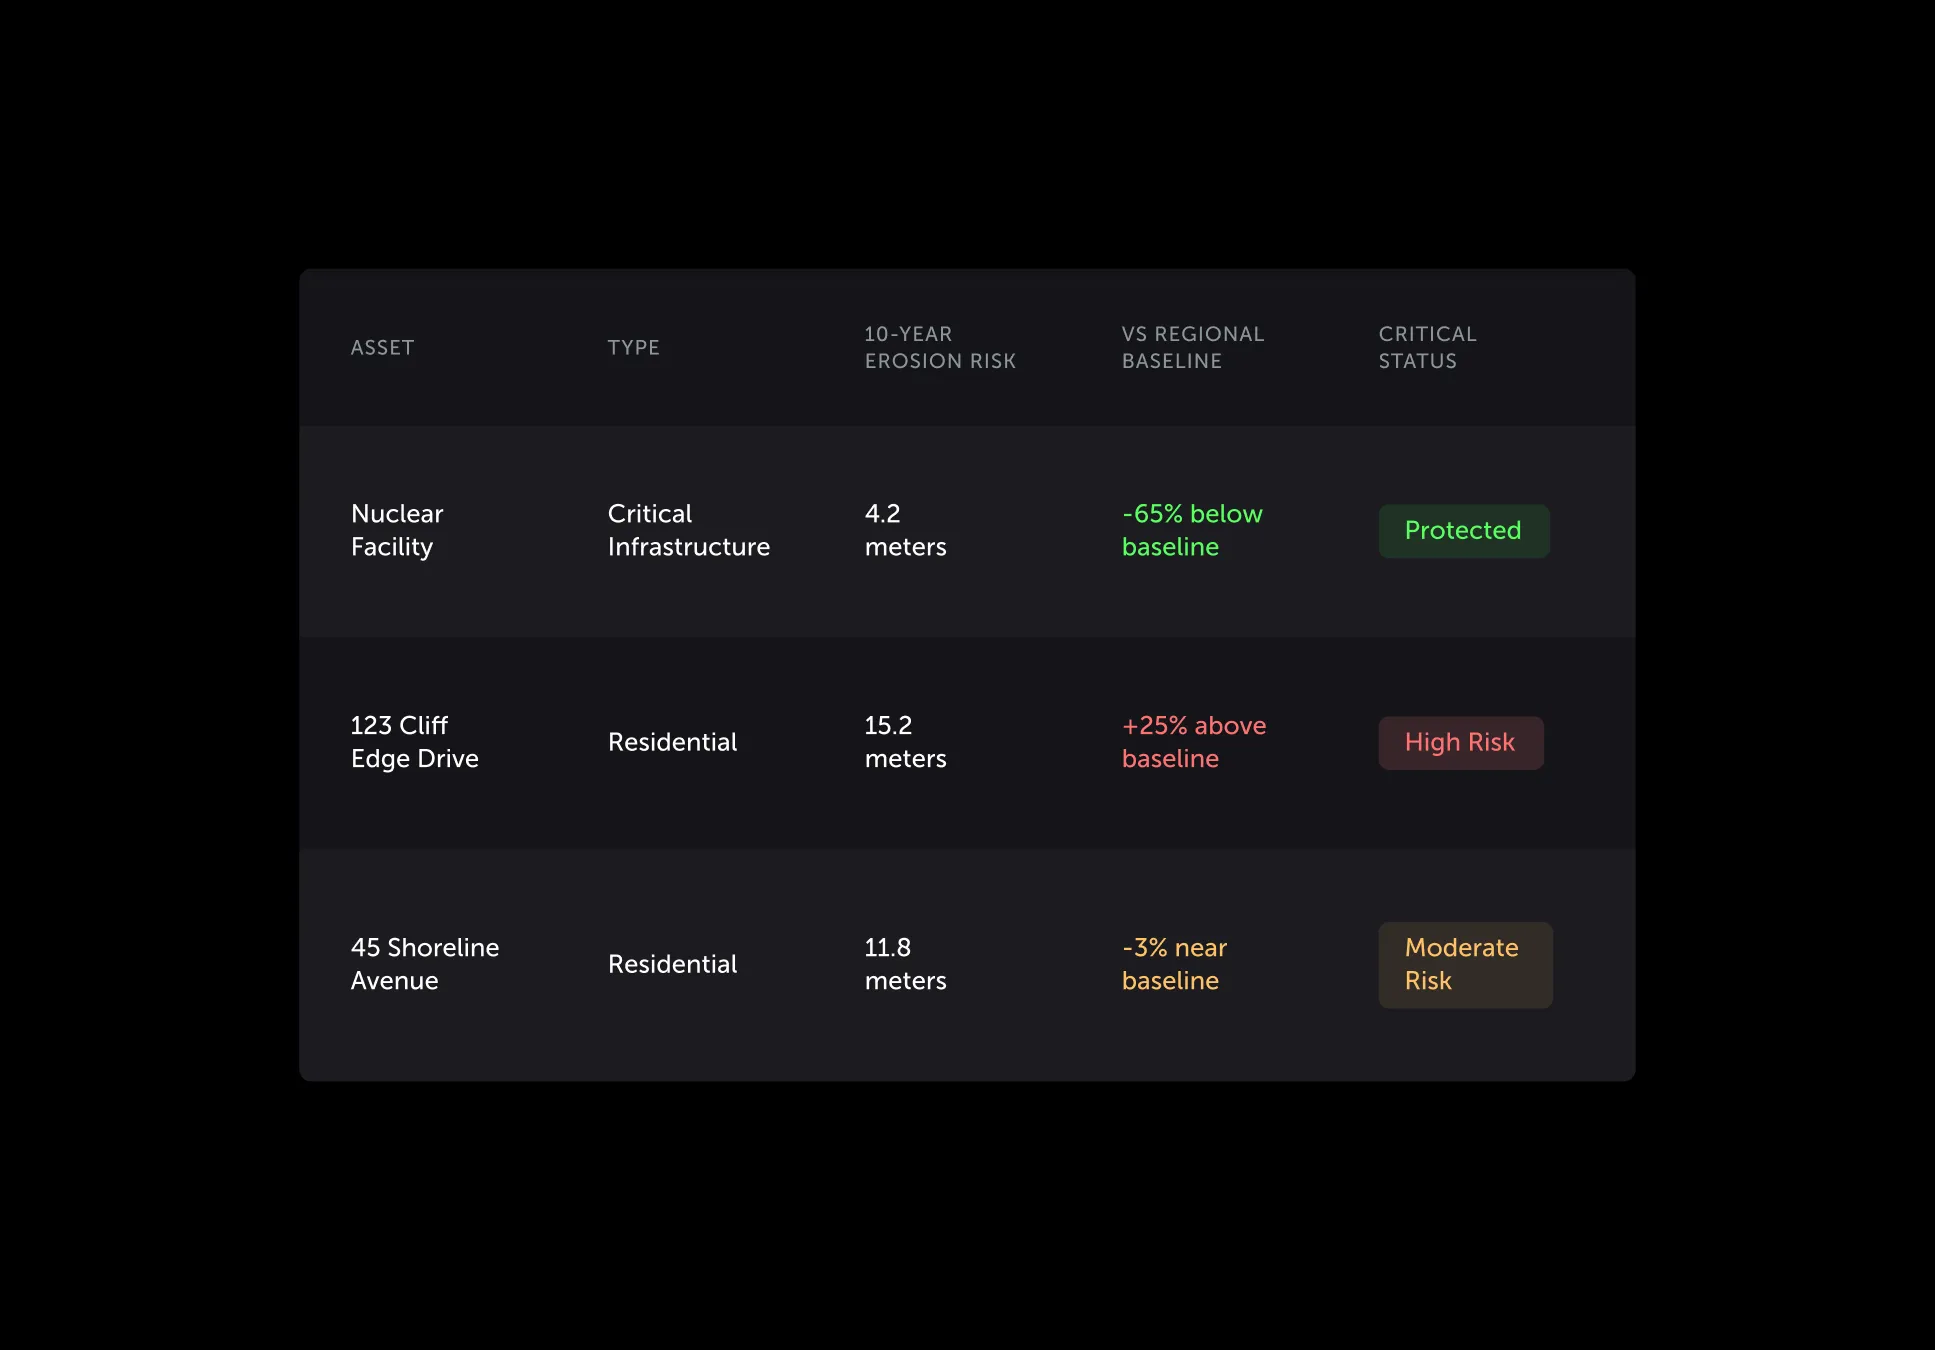
We distinguish between Primary Satellite-Derived Data Products and Advanced Insights. The latter are enhanced outputs that build upon or integrate the core insights from the Primary Products to deliver deeper, more actionable insights.

Currently, our available data products include:

  • Primary Satellite-Derived Data Products
  • Advanced Insights (enhanced outputs that build on core products for deeper analysis)


Please get in touch to request our latest Tech Report for more information on each data product.

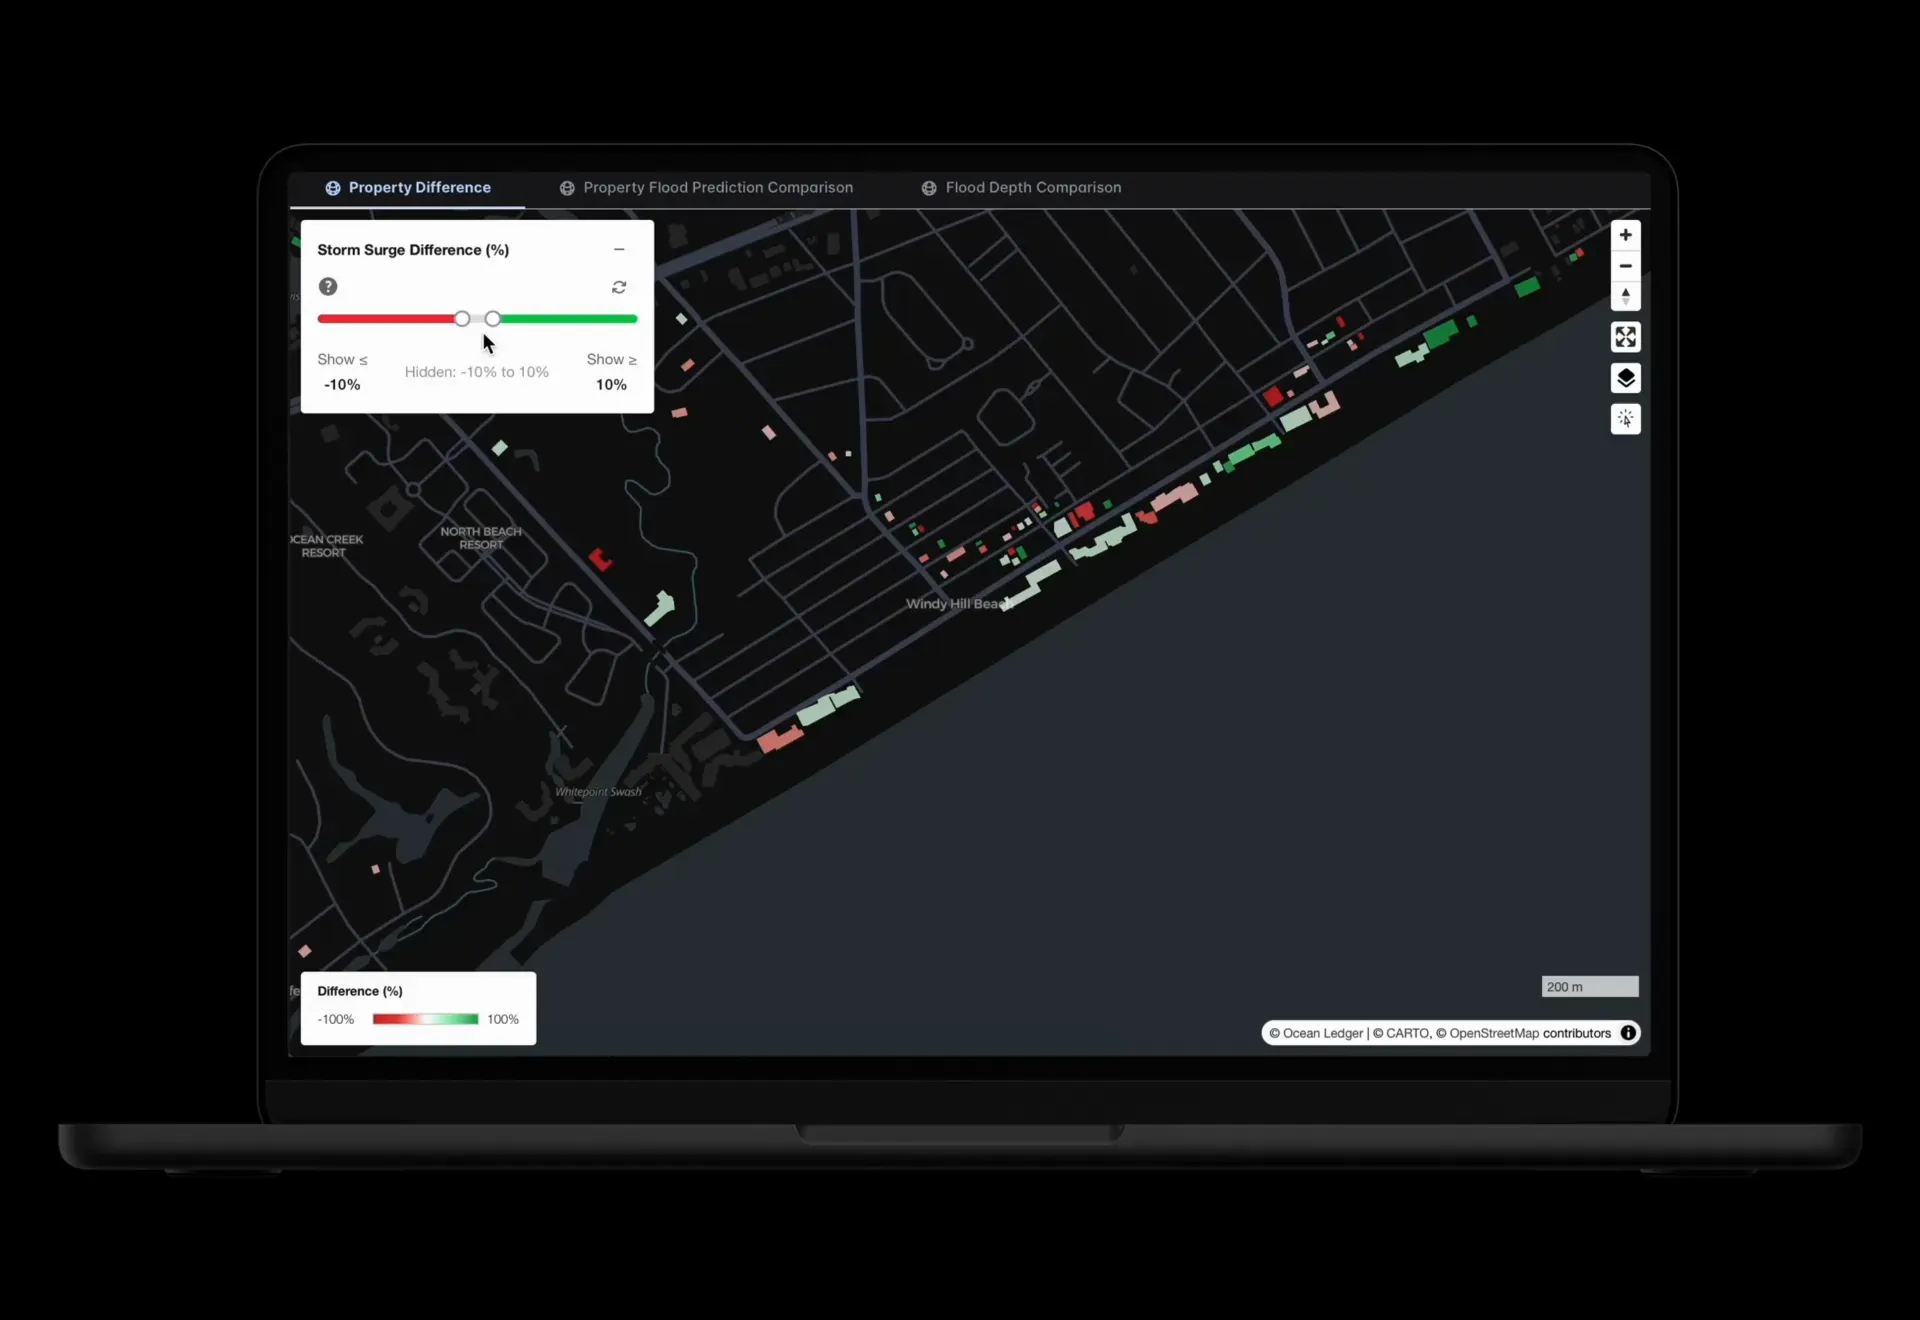
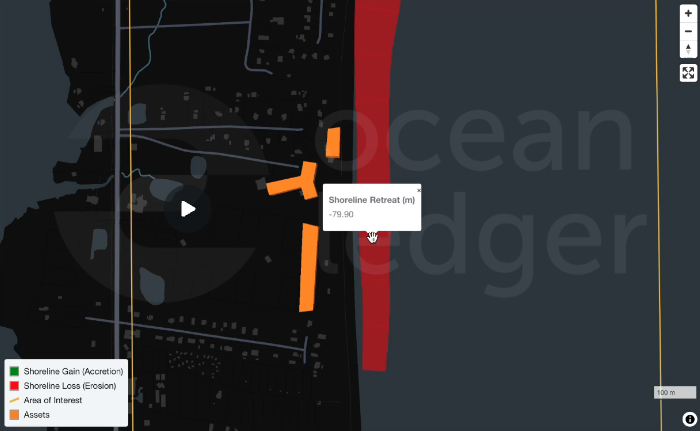
This is the main interface between Ocean Ledger and its clients. Built in-house, the dashboard offers:

  • Seamless access (API, raw data downloads) to spatial data products for erosion, bathymetry, natural capital
  • Heatmap analysis (with customisable thresholds) to identify erosion, storm surge and ecosystem degradation
  • Standardised & Custom Solutions for Scenario Analysis, Climate Modelling & Restoration Uplift
  • Trigger thresholds for early warning and risk mitigation
  • Accurate baselines and continuous monitoring
  • Transparency on data sources, accuracy, and uncertainty metrics

Yes! Please fill out our online form, and we’ll get back to you with options to demonstrate our solution for your project.

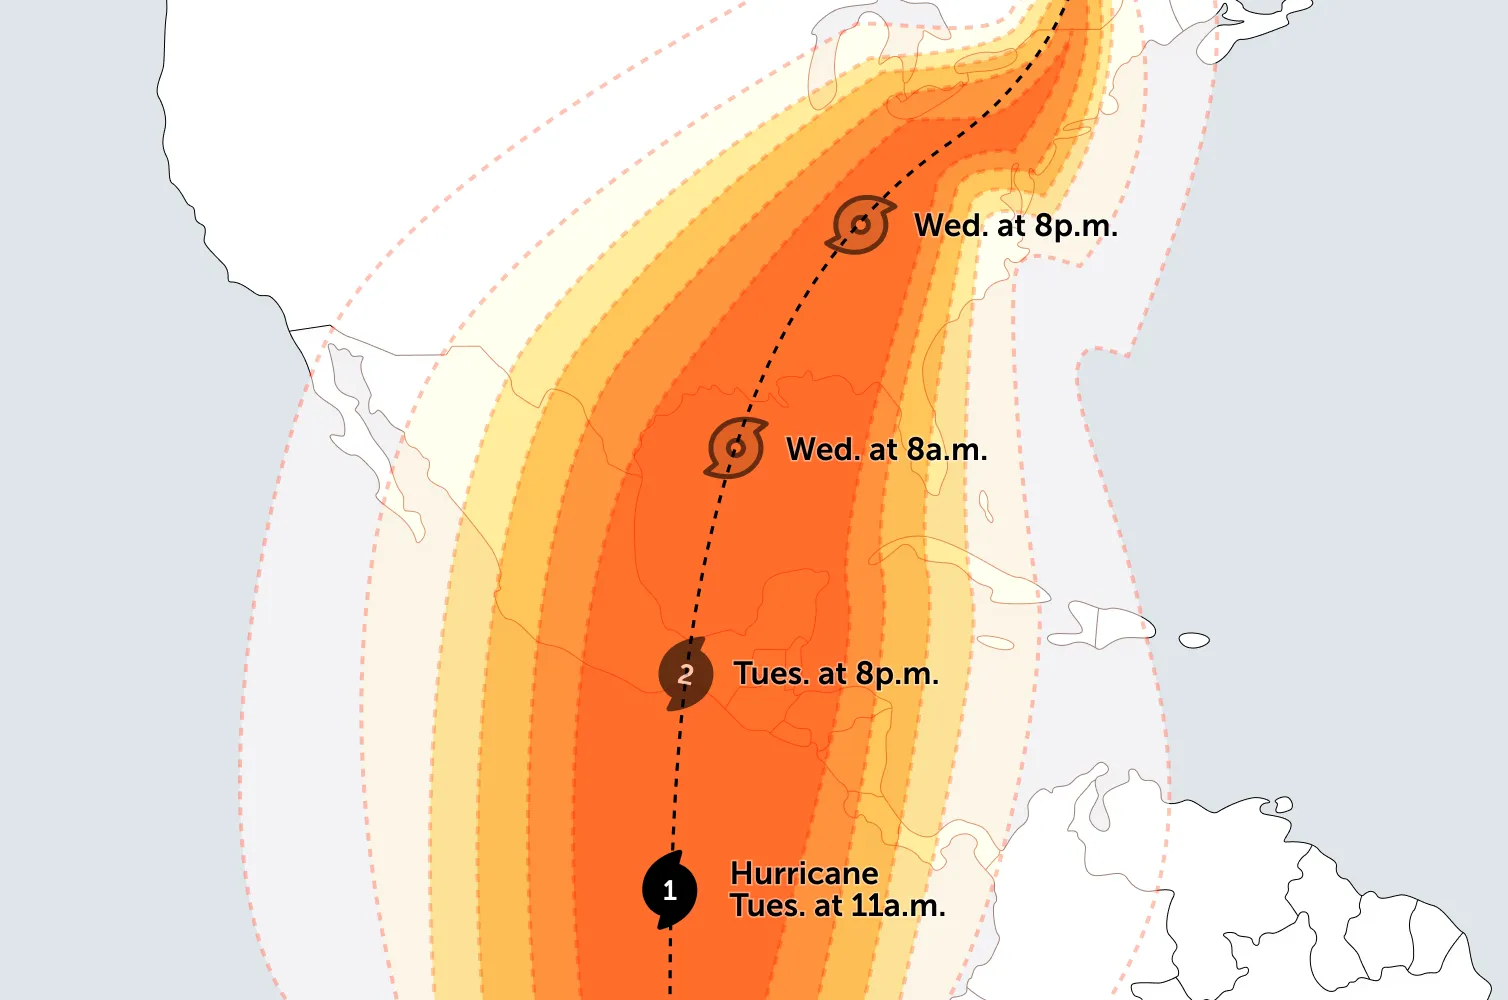
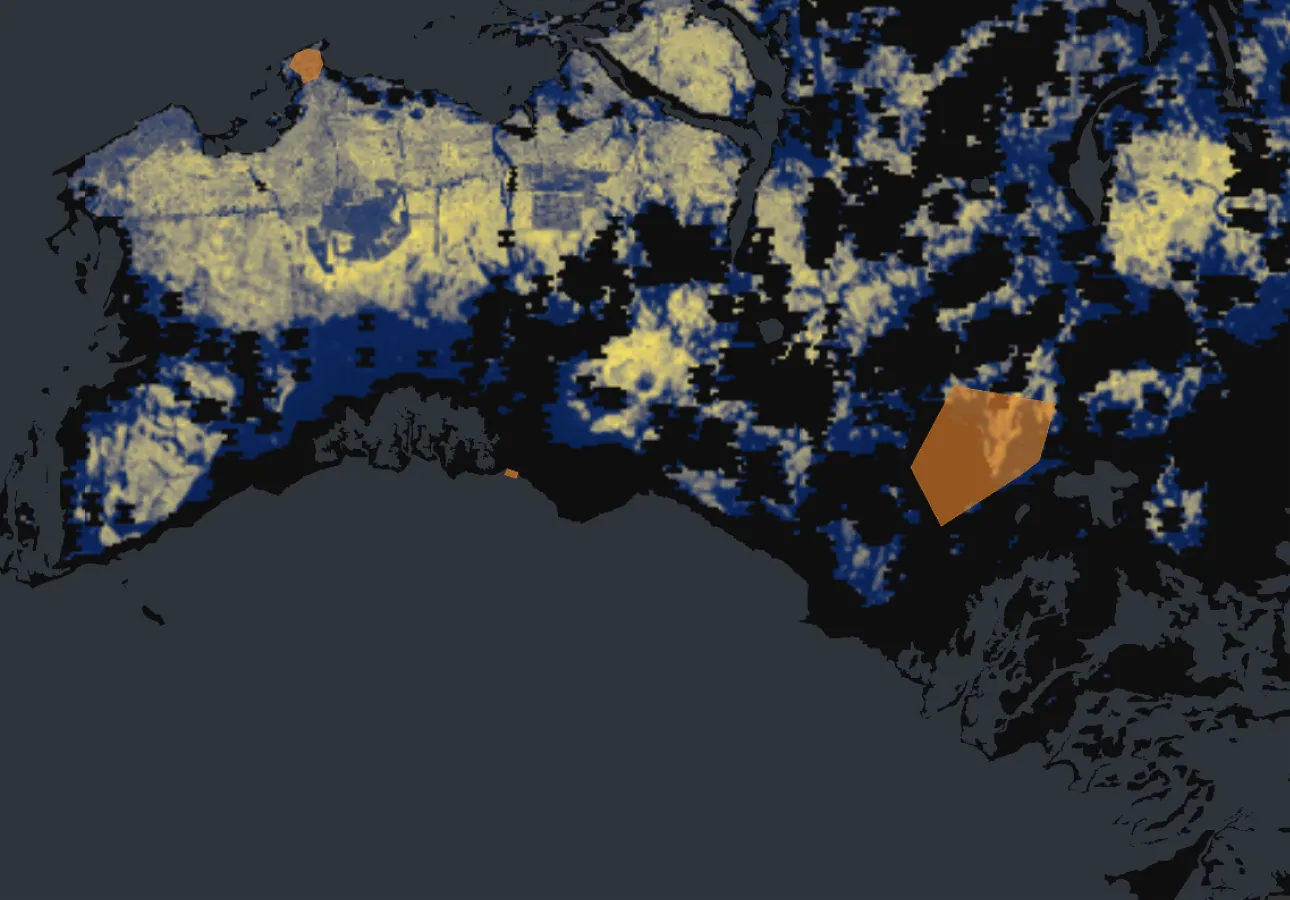
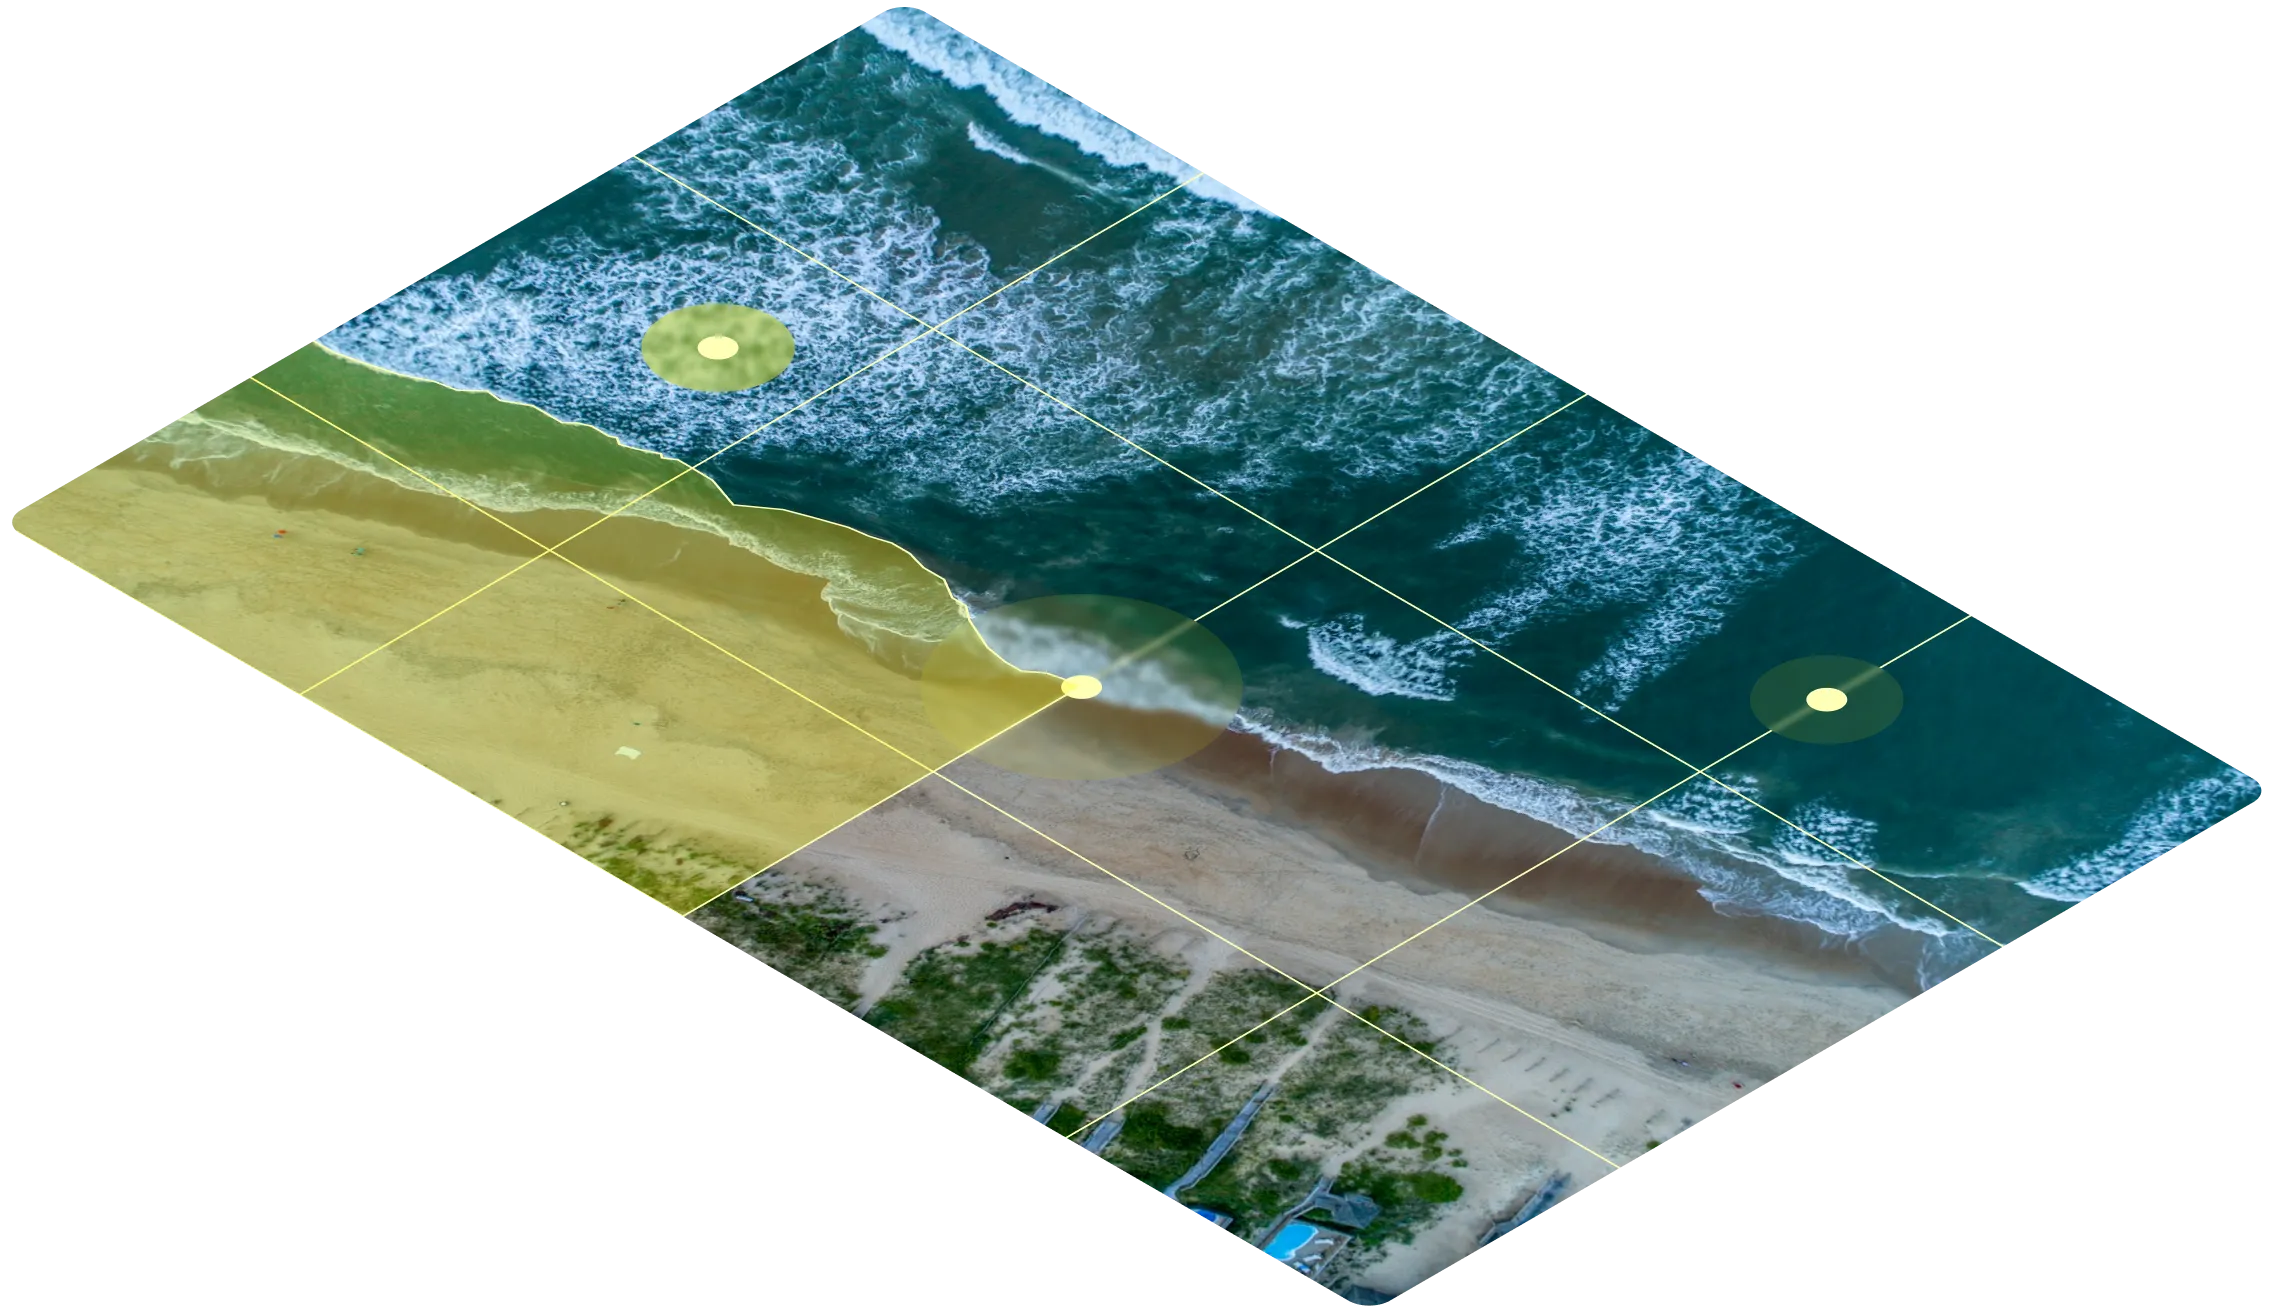
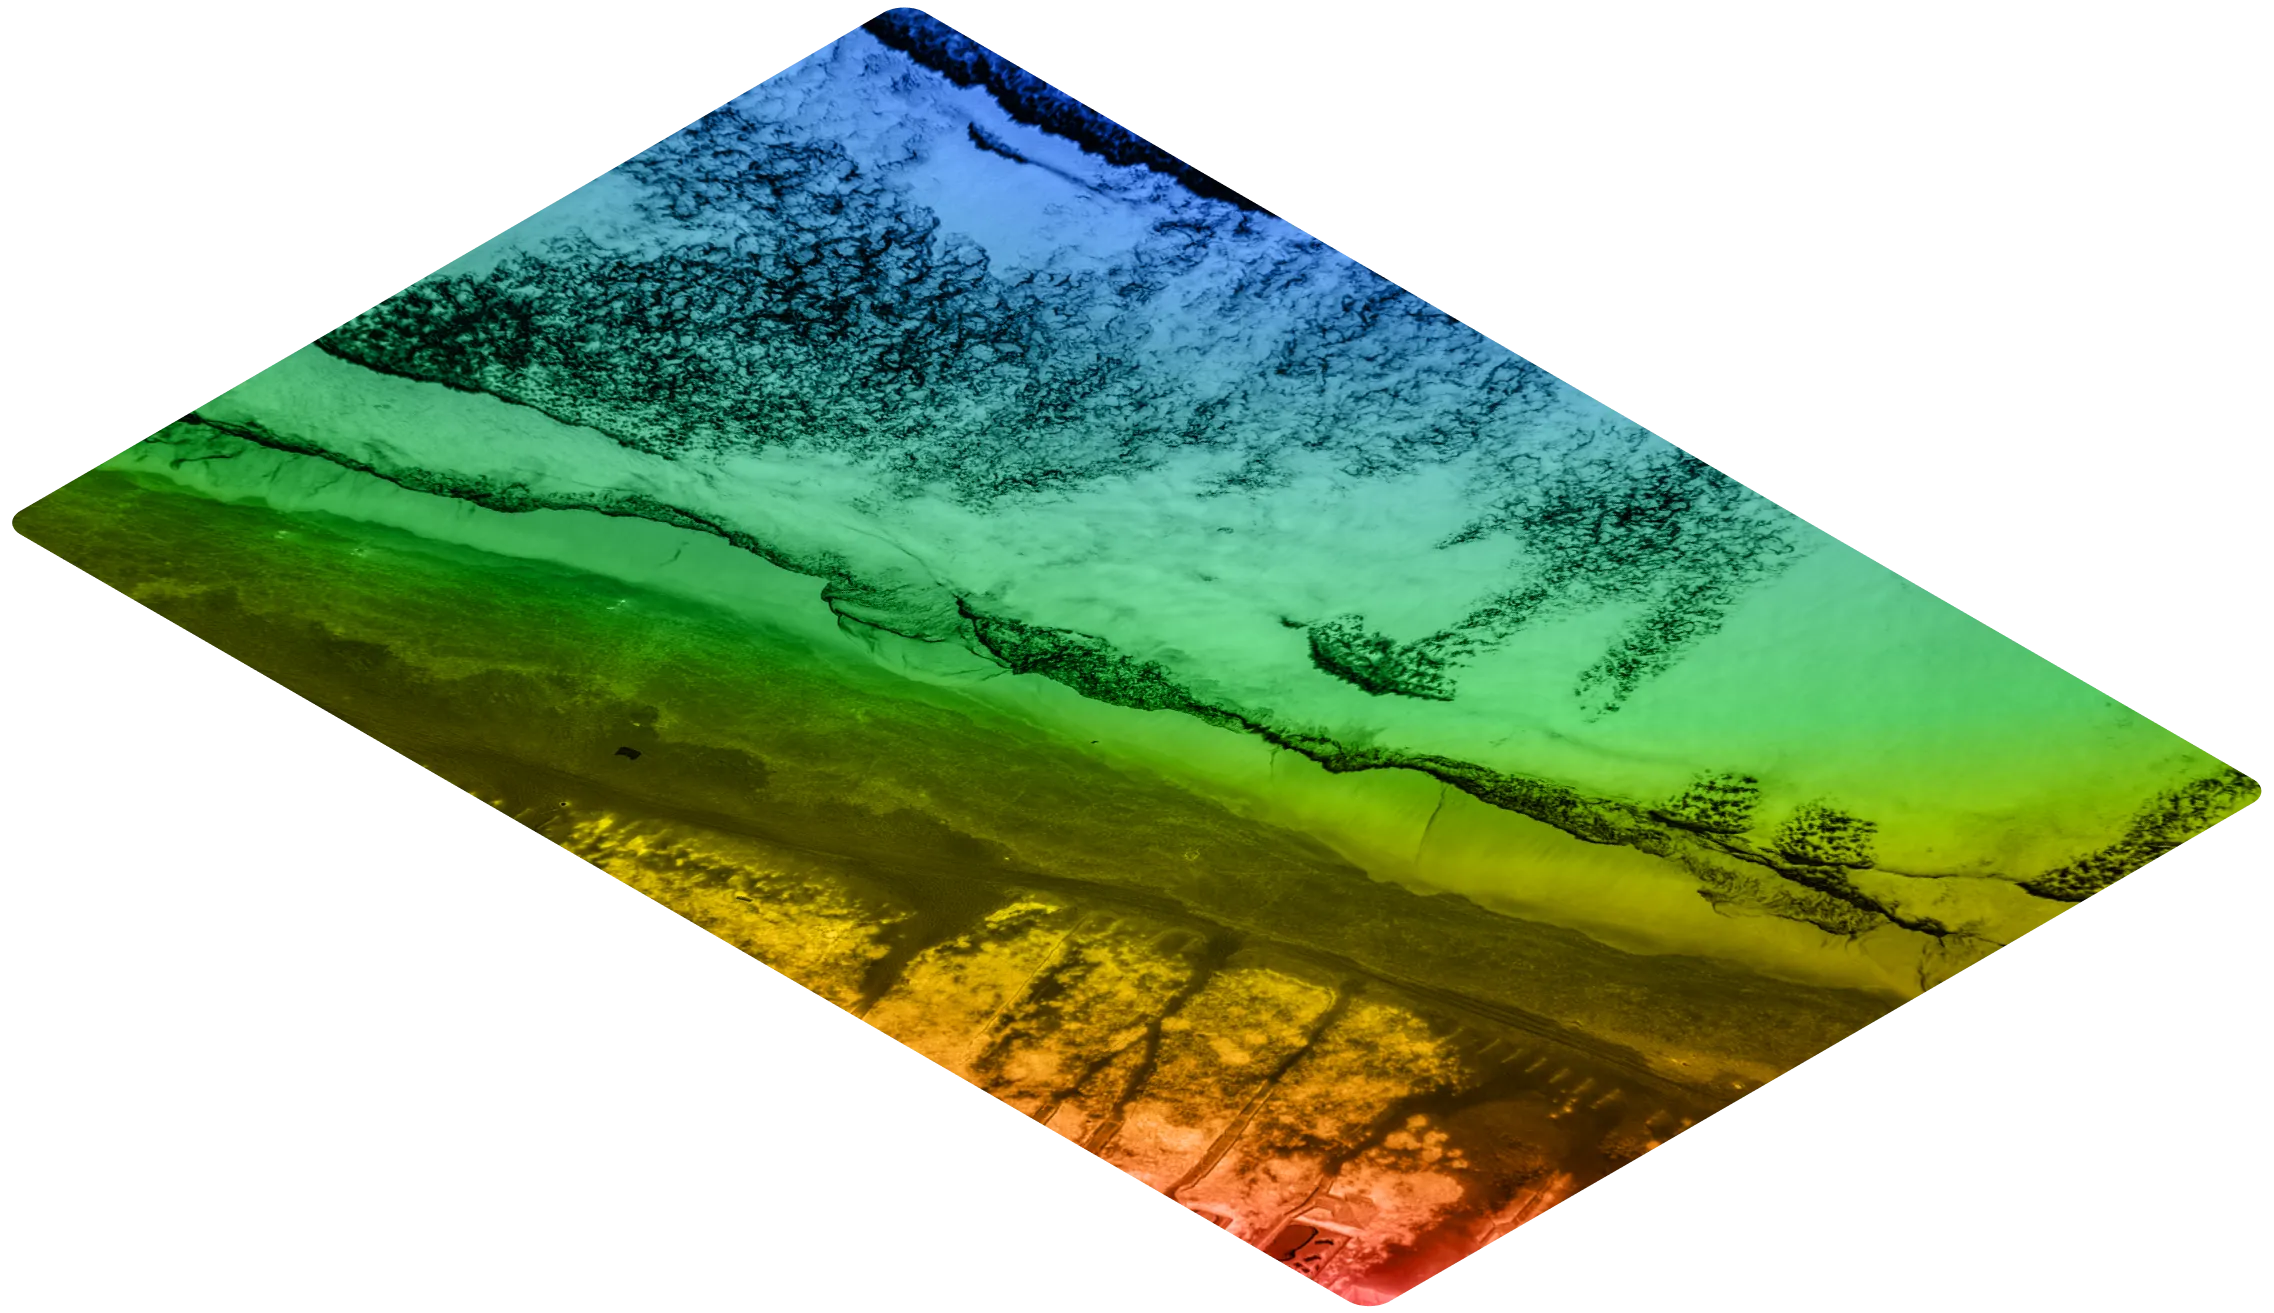
Most flood-risk and cat risk providers leverage the same digital elevation models (DEM’s). Ocean Ledger provides a next-generation DEM that fuses bathymetry, shoreline and natural defenses, which are key variables in identifying where there is more or less storm surge risk along a coastline.